This article applies as of PRTG 22
How does PRTG calculates CPU, Traffic, and Response Time Index values based on sensor measurements and historic peak values and provide a quick status overview of the network?
How does PRTG compute CPU Index, Traffic Index, and Response Time Index?
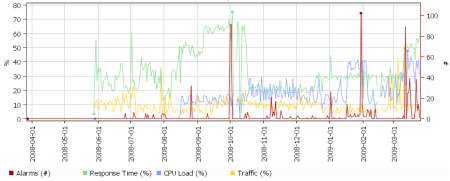
PRTG provides you with graphs to give you a quick status overview of your network. To do so, it computes so-called Index values based on the measurements of a selection of sensors. The Index graphs are synthetic values ranging from 0% and 100%, based on current sensor measurements and their historic peak values. The index calculation works similarly to a stock index, which is the computed mean value of a stock selection.
For each group and device, PRTG shows four values in a graph:

They are based on the measurements of a selection of sensors in that group (or device). The Alarms graph shows the number of alarms at a given moment in history. There are three index values:
- Response Time Index
- CPU Load Index
- Traffic Index
Examples
A CPU Load Index value of 10% for a group means that the average CPU load for a selection of CPU sensors of this group is currently at 10% of the CPU peak (historic maximum) of that group. Usually, for response times the historic maximums are much higher than the average value. For example, for pings in a LAN, a normal time might be 2-10 milliseconds (ms) while a maximum of several hundred ms is not unusual. For this reason, most Response Time Index readings are usually between 10% and 20%.
How does it work?
- During the regular network monitoring process, PRTG records the highest value ever measured for each sensor.
- The currently measured value is weighted against this upper liminal value to compute an index value for a sensor between 0% and 100%.
- For each device, the index values for CPU load sensors, traffic sensors, and sensors that measure response times are combined.
- For each group, the index values of all devices are combined.
Keep in mind that changing the sensor setup (the number and types of sensors) also inevitably changes the index values because the numeric base for the calculation changes. This means that values before and after a configuration change may not be comparable at all. The same applies to situations where one or more sensors cannot be monitored (for example, when a probe is disconnected).
Disclaimer:
The information in the Paessler Knowledge Base comes without warranty of any kind. Use at your own risk. Before applying any instructions please exercise proper system administrator housekeeping. You must make sure that a proper backup of all your data is available.
